The data in Database Tour are shown in enhanced database grids, which allow viewing and editing data in the most convenient way. Some of the features, described below, need focused database grid (to focus the grid, simply click its area) to work.
Editing Data
To start editing data in the grid:
- Double-click the needed cell
or - select the needed cell and press F2
or - select the needed cell and then click it
or - select the needed cell and start typing text.
The changes are saved when:
- clicking Post Changes button in the upper toolbar;
- leaving the current record (i.e. picking another record by the mouse or using keyboard); when working with explicit transactions, consider issuing COMMIT to permanently save the changes.
Notes
- Editing BLOB data in the grid is not allowed (except long text like Memo or Clob) although viewing graphic data is possible. To edit BLOB data, use the BLOB Editor.
- Editing Boolean data can be easier.
Single Record View
The data in the grid can be presented in two views: standard multiple records view, where you see field (column) names in the top row and data records in other rows, and single record view (often called as vertical grid), where you see the selected record in two columns: field (column) names to the left and field (column) values to the right. To toggle between these modes, use the corresponding button ![]() of the main window or the button
of the main window or the button ![]() in the top-left corner of the grid.
in the top-left corner of the grid.
Table in the multiple records mode:

Table in the single record mode:

Summarizing Selected Cells
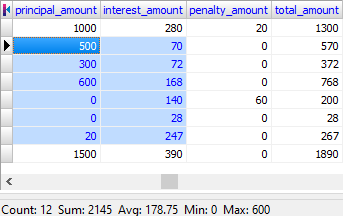
When you select a range of cells by mouse, the application automatically summarizes the cell values and shows the result in the status bar. For numeric cells, it includes count, sum, average value, minimum value, maximum value. For other cells, the count of selected cells is shown.

Checking Field Type
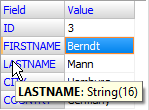
To quickly view field name and type for any column, just move mouse over the column title. This works, if Show column hints option is set.
Showing field name and type in the multiple records mode:

Showing field name and type in the single record mode:

Viewing Large Text
To quickly view contents of CLOB/MEMO (large text) field or any field, which data does not fit the database grid cell, just move mouse over the cell. This works, if Show data cell hints option is set.
Showing contents of field with large text:

Showing data which does not fit the cell:

Viewing and Editing Boolean Data
Boolean data can be shown as checkboxes (this depends on the appropriate view option). To edit such data, just click the center of the cell, press Space key or simply type 'False' or 'True'.
Showing boolean data:
![]()
Data Sorting
To sort the data by any column, just click the column title. To sort in descending order, simply click it again. To sort by several columns, click their titles in needed order holding SHIFT down. Note: This feature always works for query data; for tables, it works only if the field is included in index or if such sorting is supported by used database server or database engine (database interface).
Sorting data:

Rearranging Columns
To rearrange columns, just click the column title and move it to new place holding left mouse button down.
Freezing Columns
To freeze or unfreeze any column (to prevent or allow its horizontal scrolling), use the corresponding button ![]() .
.
Selecting Group of Records
To select group of records, use the corresponding button ![]() .
.
Auto-scrolling Data
To auto-scroll the table, click mouse wheel and than slightly move the mouse in the needed direction. This will cause the data to be scrolled automatically. To increase the scrolling speed, simply move the mouse further from initial position. To stop auto-scrolling, just press any key or click the mouse button. This feature is useful for large data sets.
Auto-scrolling:

Expanding Rows
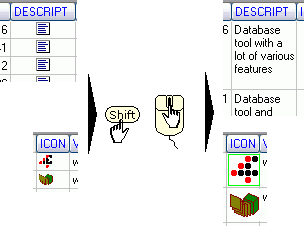
To expand rows (i.e. increase row heights), roll the mouse wheel holding SHIFT down. This lets you viewing long text, CLOB, or graphic data. Pressing + or - on numeric keypad holding CTRL down does the same.
Expanding rows:

Notes for Graphic Data
Usually BLOB fields can contain not only graphic data, but different types of data. Paradox graphic fields are usually interpreted as fields for bitmap images. For other types of BLOB fields, Database Tour in some cases can automatically detect the actual type of data in those fields and show this data properly. Note, that it can automatically detect only several graphic formats (bitmap, metafile, icon, JPEG, PNG) and some other formats (for example, RTF) and only if the data contains all needed information (e.g. headers) for this.
When the data type is successfully detected, the Database Tour data grids shows the corresponding images directly in data cells (if the corresponding option was set in Options | Environment | Data View).
![]()
Hiding a Column
To temporary hide selected column, press CTRL+H. To show hidden column, right-click the database grid, choose Show Hidden Column from the context menu and choose hidden column's field name. To show all hidden columns, choose Show All Columns from the context menu.
Auto-Sizing Column Width by Content
To auto-size a column's width depending on its content, double-click the right edge of its header (like you do in Excel). To autosize all columns, double-click the right edge of any column's header holding Ctrl down.
Fine-Tuning Column Width
To fine-tune the column width, press left (decreases the width by one pixel) or right (increases the width by one pixel) arrow holding Shift down.
See also


