Data View
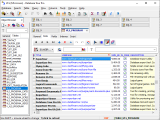
Database Tour shows data in enhanced database grids, which allow viewing and editing data in the most convenient way.
Customizing Column View
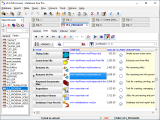
There is a convenient interface to customize the font and background of each individual column in a data set, i.e. apply the data grid skin (style). The skin can be saved to file and loaded from file.
When exporting the data set with customized columns to HTML, Excel (XLSX), ODS, PDF, or RTF formats, the columns' formatting can be preserved when using the corresponding export option.
Single Record Mode
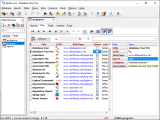
Single record mode is activated in the right side of the database grid, when corresponding button is clicked.
In the single record mode, you can see the selected record in two columns: field/column names to the left and their values to the right. This is especially convenient when there are many db fields in the grid, so you can browse or edit the data in a compact view without horizontal scrolling.
Changing Row Heights
Blob Data Viewer and Editor
Despite it is possible to view the large text and graphic data directly in the Database Tour data grids (see above), the Blob Editor tool offers you more capabilities to work with such data.
Another useful application of the BLOB Editor is previewing reports, stored in BLOB fields (Pro version only).


